


New statistics
Several helpful new statistics are now available in Seafloor Planner:
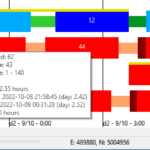
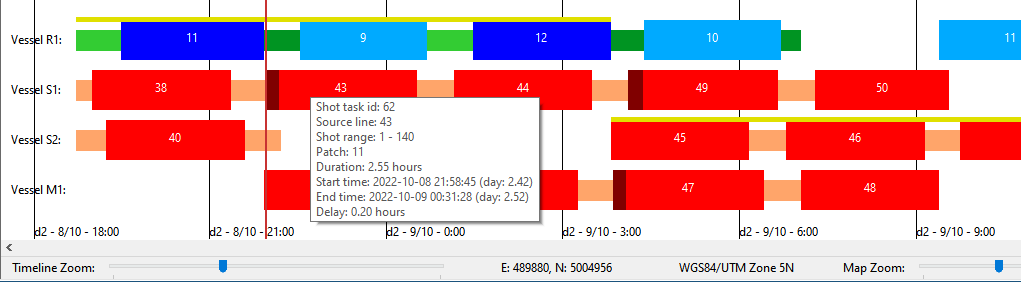
- When hovering over a task in the timeline at the bottom of the SFP window, the task start and end times are displayed in terms of days since the start of the survey. Previously, these times were only displayed in terms of dates.
- The Summary details panel, Simulation details panel, and CSV periodic exports now include new totals for each vessel type: Total time, total wait time, total production time, and total transit time.
Bug fixes and usability improvements
-
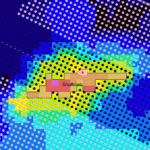
- Usability: Shot points are now selectable in the map, with shot point properties shown on the Selection Details display.
- Usability: A rectangle representing the offset range for the current shot point is now shown, if toggled on in the map legend, as a source vessel moves along a line.
- Usability: When calculating which shot points are in range of a receiver line on a rolling spread (progressive shooting) survey, SFP now takes into account the position of each individual shot point, whereas previously it only considered the straight line between the first and last shot points. This will make a difference in projects that contain source and/or receiver lines that are not perfectly straight. Note that large projects may take a little longer to build, due to the additonal calculations involved.
- Usability: Shot lines in the right-click > Selection context menu are now listed in terms of line name rather than internal line ID.
- Fixed: Georeferenced images may no longer be displayed after closing and opening a project several times.
- Fixed: SFP freezes when opening a project that contains a WMS image, if it is not currently possible to connect to that WMS.